Arborsonic 3D Acoustic Sonic Tomography: Detecting decay within trees
Detecting Decay within Trees
One challenge with assessing tree safety is that so much of a tree is not visible. The wood inside a tree and tree roots underground are often concealed from us, and while we can determine certain things regarding tree health from what we can see, being able to see the inside of a tree. We can provide hugely valuable information to help provide the best management recommendations for a tree.
How Sonic Tomography Works
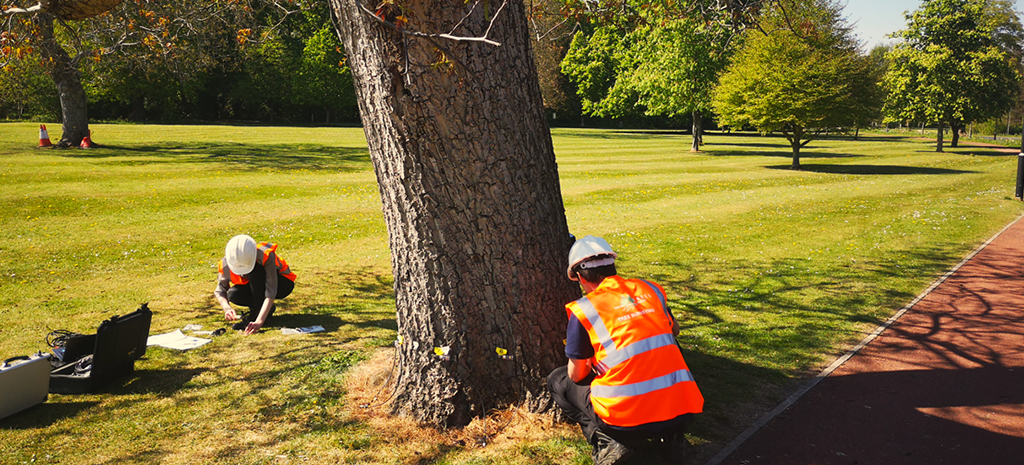
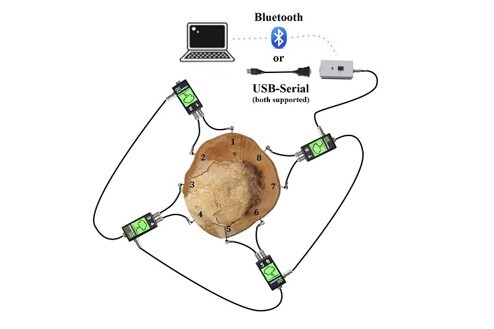
Sensors are placed around a tree and sound waves are fired between the sensors to give an illustration of the amount of sound wood and decayed wood within a tree.
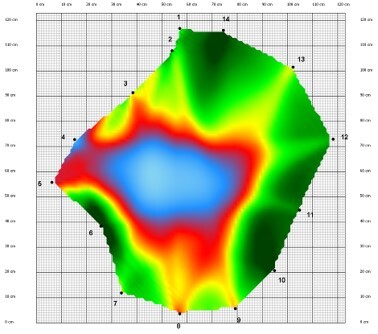
Sound waves travel faster through solid wood than through decayed wood. Using this data, the software provides a picture of the inside of a tree, showing the sound wood where the sound waves have travelled quickly through, and areas of decayed and decaying wood, where the sound waves have travelled slower.
Results
The relative speed of the sound travelling between the sensors is calculated by the ArborSonic Tomography software. This software uses the data to construct a two-dimensional image (or a three-dimensional for multiple layers of assessment) of within the tree. The images generated shows zones of differing sound transmission properties within the stem, and the software sets and assigns colours to show these different zones. This gives us incredibly valuable information on the probability of failure and the future life expectancy of a tree, assisting us with choosing the most suitable and achievable management options. 
Please contact us for further information on ArborSonic 3D Acoustic Tomography or for a free no obligation quote for our decay detection test services.
Electrical Impedance Tomography
An ArborElectro Impedance tomogram is used to detect the size and location of active fungi. We pass an electrical current between sensors placed around the trunk of a tree. The current measures electrical resistivity which can pick up changes in moisture content and ionic concentration.
The resistivity increases and decreases when there are changes to ionic concentration. This makes it possible to detect early fungal attacks, and is therefore an incredibly insightful tool in predicting the future decay potential and spread.
Results
The program will calculate the resistivity map of the selected cross section. Resistivity increases/decreases if there is a change in the ionic concentration, therefore fungi attacks even in very early stages may be determined.
Gaining this detailed information offers a greater understanding on the likelihood of tree failure to guide the best management decisions.
We are able to offer full ArborElectro Tomography testing with ArborSonic Acoustic tomography testing to give a comprehensive analysis of decay within trees.


